*click the link below this image to access the interactive data tool*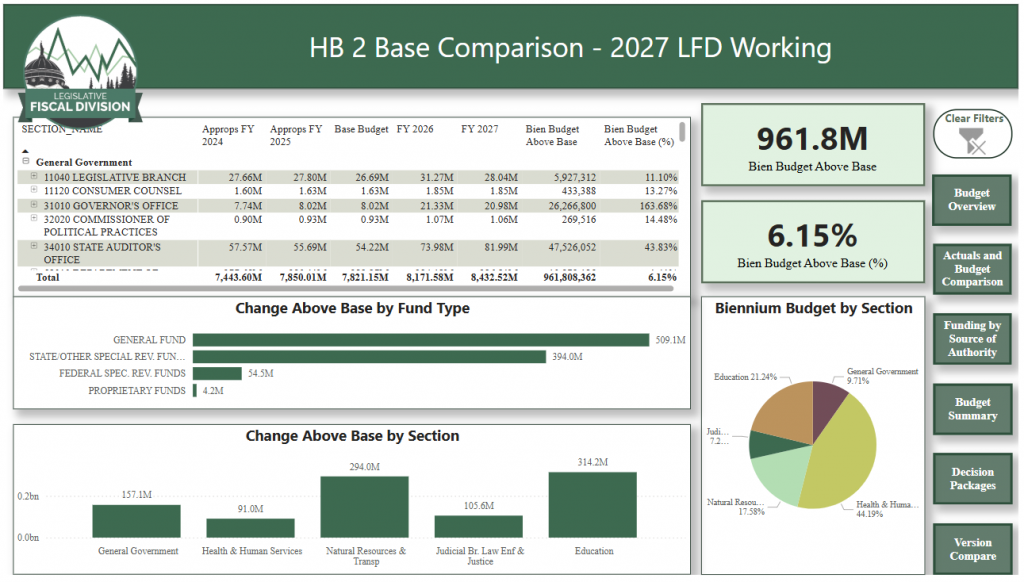 » Biennial Budget Comparison
» HB 2 Expenditure Budget Comparison

*click the link below this image to access the interactive data tool*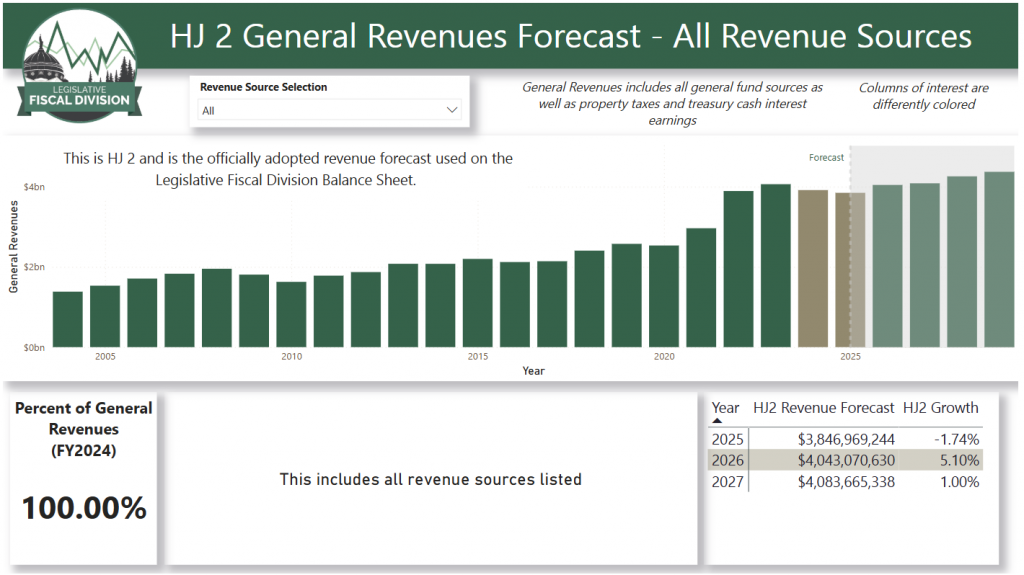 » HJ 2 General Revenues Forecast
Other Revenue Tools
*click the link below this image to access the interactive data tool*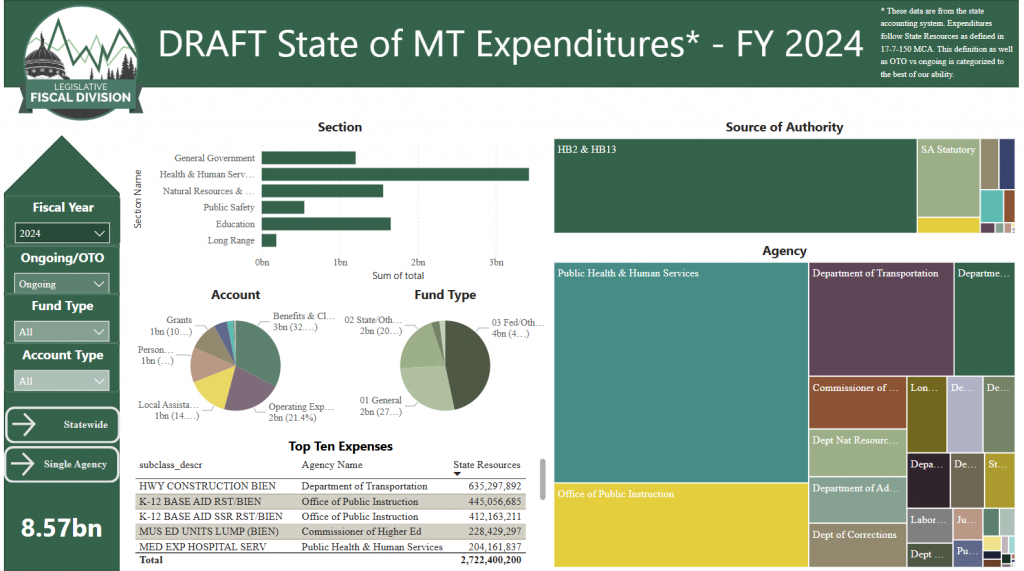 » State of Montana Expenditures FY 2024

THRIVING IN A CHANGING WORLD
DATA DRIVEN DECISION MAKING
The accordions below were developed by legislative non-partisan staff under the direction of the Modernization and Risk Analysis (MARA) Committee to demonstrate the long-term comprehensive look at the interconnectedness of government in Montana. Navigate these accordions for more information from studies, reports, and interactive data tools.
Data Separated from Politics • Questions & Curiosities • Beyond the Two Year Window
MARA's work is important because it puts together tools for legislators, other decision makers, and citizens that use real Montana information to answer questions that we are facing. I believe that the tools MARA assembles, on topics ranging from cost of living data to taxation issues, and health care to education, will be invaluable in making decisions that benefit Montanans.
Senator Janet Ellis, Vice Chair MARA Committee
Legislators are consistently asked to address problems and challenges. . . MARA is all about making sure well vetted data is readily available to inform legislative decision making.
Representative Llew Jones, Chair MARA Committee
MARA is unique because we are attempting to use data and modeling to look out a decade or more to project where Montana will stand in the more distant future. It is an important exercise because our work from session to session, particularly around budgeting, is focused on the immediate term. So, MARA's long-term lens is uncommon and can complement the policy work of our other committees.
Representative Bill Mercer
ABOUT
The 2040 MARA project began in 2019 with a gathering of legislative questions about the Montana economy, demographics, and financial implications. Those questions were discussed in January 2020 during a gathering of the legislature. Work paused during COVID-19, but resumed June 2021 with a specific focus on gathering and compiling data to see the interconnectedness of government between the state, local governments, and schools. Legislative staff built interactive modules of the data, but time did not allow for analysis and refinement of the model. Next steps for staff will be at the discretion of the legislature and current plans are provided below.
Next Steps for the 2040 MARA Project
*click the link below this image to access the Public Safety data tool* » Agriculture Data Tool
*click the link below this image to access the Public Safety data tool*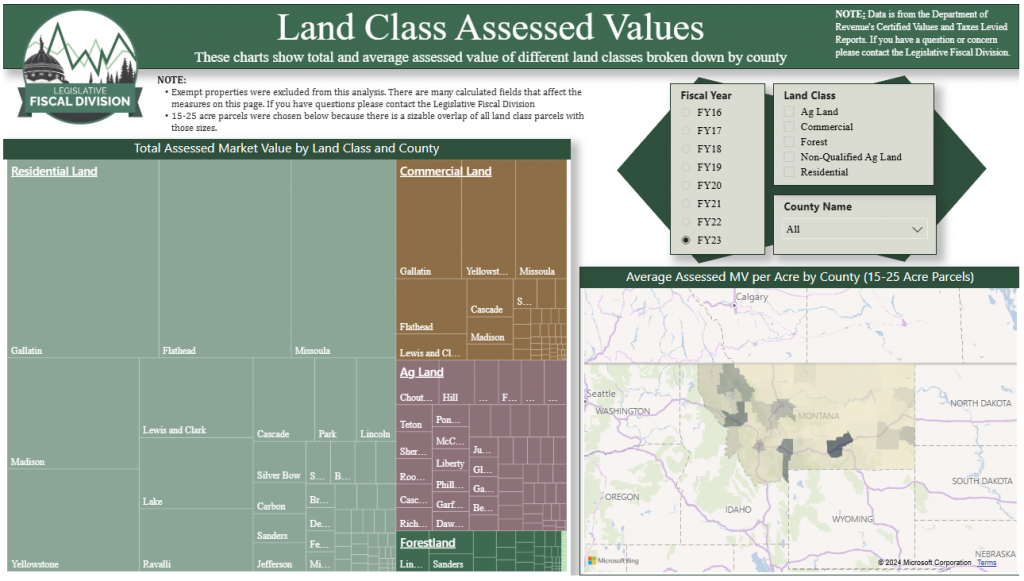 » Land Class Assessed Values Data Tool
ABOUT
As part of the MARA project’s modular approach the committee and several national experts discussed trends in cost of living, including housing and childcare. Staff created visualizations of trends in Montana’s housing market and childcare system. Read below for more on the cost of living in Montana.
KEY TAKEAWAYS
*click the link below this image to access the Cost of Living data tool* » Montana Cost of Living Tool
*click the link below this image to access the MT Housing Sales data tool*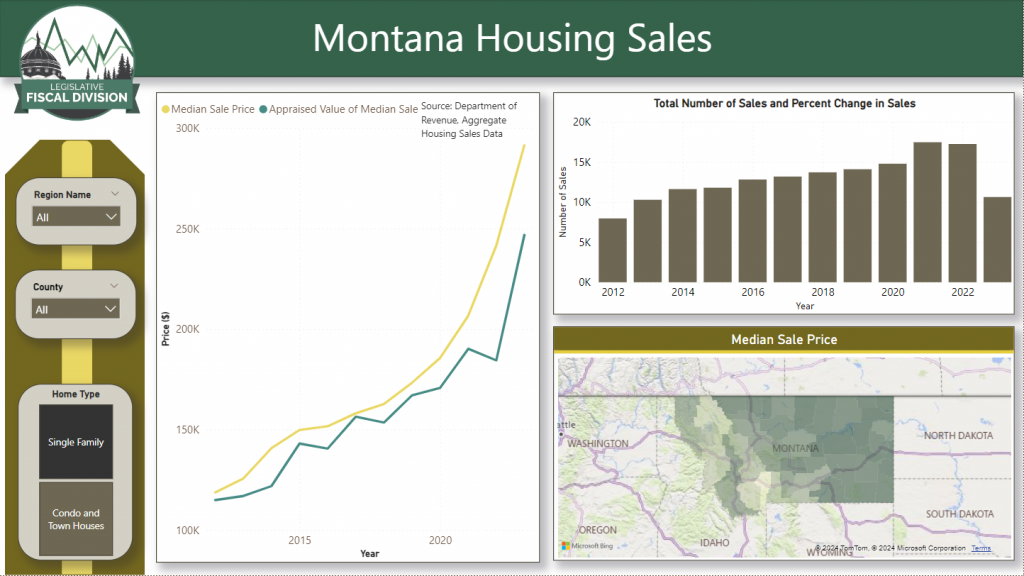 » Montana Housing Sales Tool
ABOUT
MARA looked at the current and future Education trends. The investigation led to further work and research by the Education Interim Committee and the Education Interim Budget Committee and other education leaders in the state. Links below capture the work of the various entities.
In addition, a tool was created to look back and look forward, comparing school revenues and expenditures by district. With the creation of this tool, comparisons and further analysis can be done relatively quickly as legislative questions arise. See below for the basic analysis of school revenues and expenditures.
KEY TAKEAWAYS
Education leaders surmised that the following areas of education policy need the highest level of attention:
Several trends in school revenues and expenditures seen in the interactive tool below are the following:
*click the link below this image to access the Education data tool*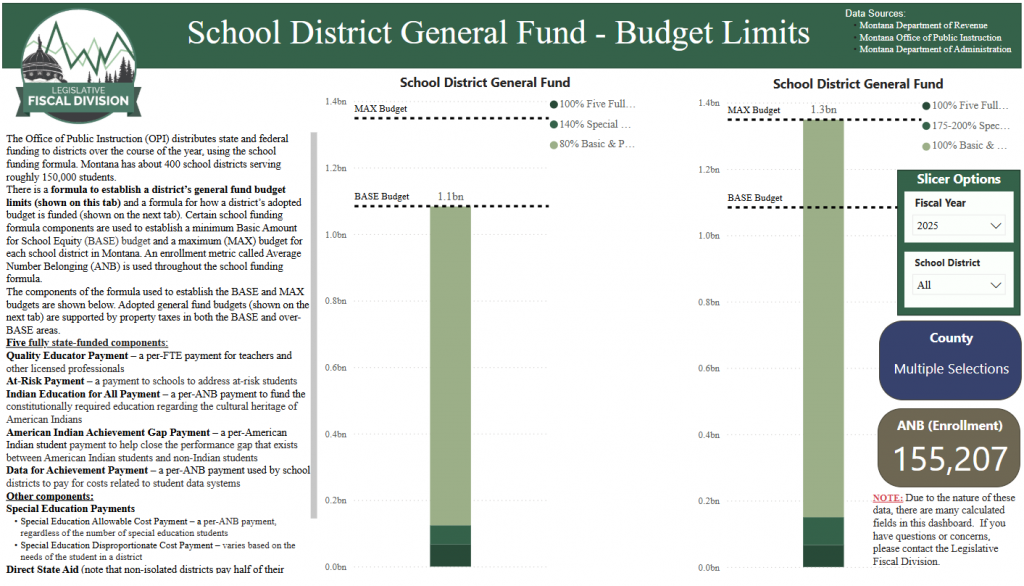
» School District Funding Tool
ABOUT
As part of the MARA project’s modular approach the committee discussed the future of health care. Staff created a projection of future trends in Montana’s Medicaid system, which is easily the largest state health program. Read below for more on Medicaid and the future of health care.
KEY TAKEAWAYS
*click the link below this image to access the Healthcare data tool* » MARA Medicaid Projections
ABOUT
Local governments, along with state government and schools, are one of three large government financial areas that affect all Montanans. As such they are an important piece when examining total governmental services and tax burden. One of the major areas of overlap is in the property tax system, the work here expands the ability to examine that system as a whole.
These data shown below are the submitted revenue and expenditure data from local municipalities to the Department of Administration (DOA). In response to this project DOA put in additional effort to get this data set as complete as possible, and this now gives a better representation of municipality revenues and expenditures than had been achievable prior to this work. While the forecast on municipalities is not yet complete, these data provide LFD the starting point to create forecasts and do property tax linkage work.
The Legislative Fiscal Division wishes to thank the executive branch’s data effort for their collaborative role in the continued development of diverse data collections. When these data are available, both the legislative and executive branches will be enabled to provide improved analysis for decision makers.
KEY TAKEAWAYS
*click the link below this image to access the Local Government data tool*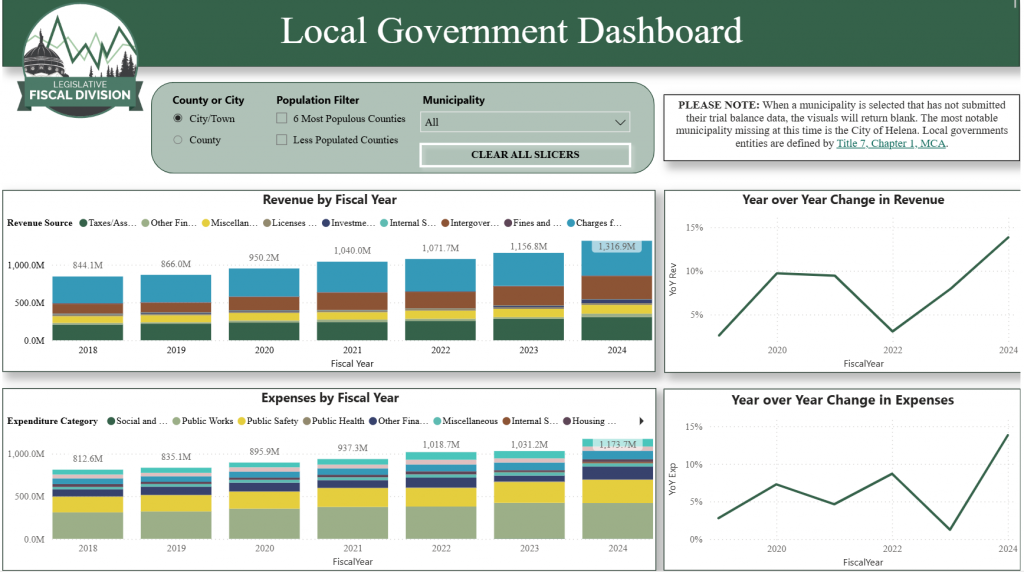 » Local Government Historic Revenues & Expenditures Tool
*click the link below this image to access the Local Government data tool*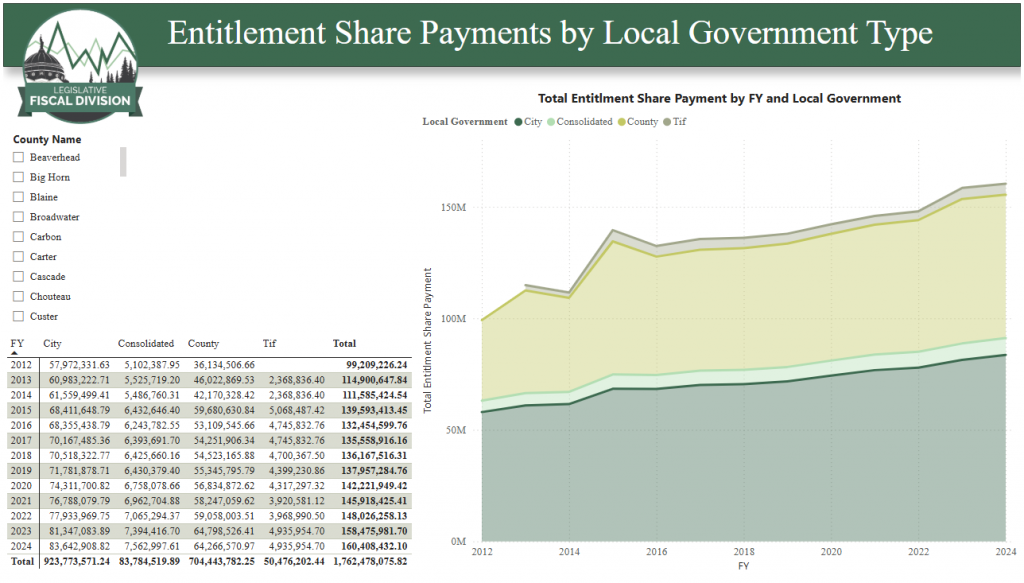 » Entitlement Share Payments Tool
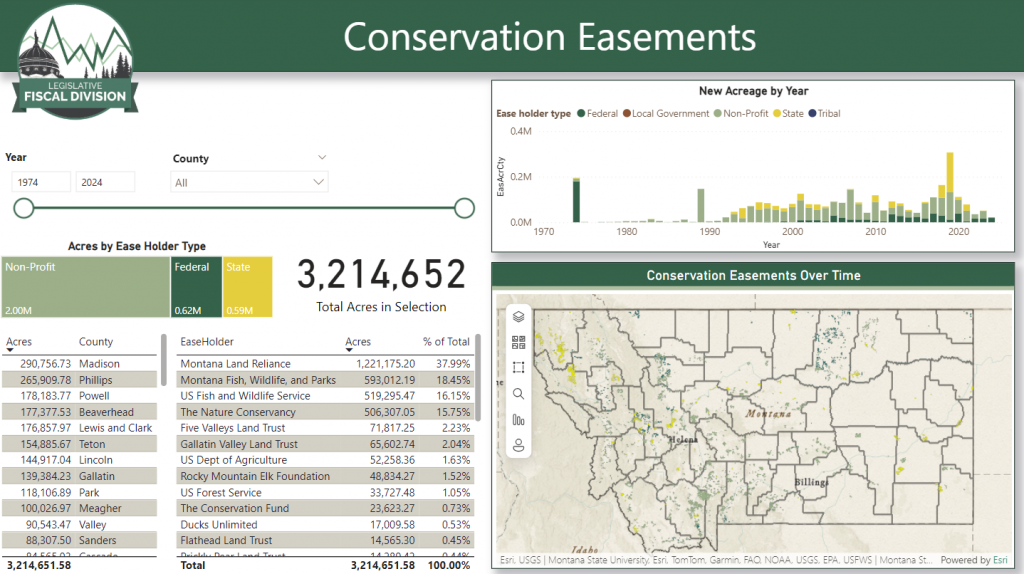
» Conservation Easement Data Tool
*click the link below this image to access the interactive data tool*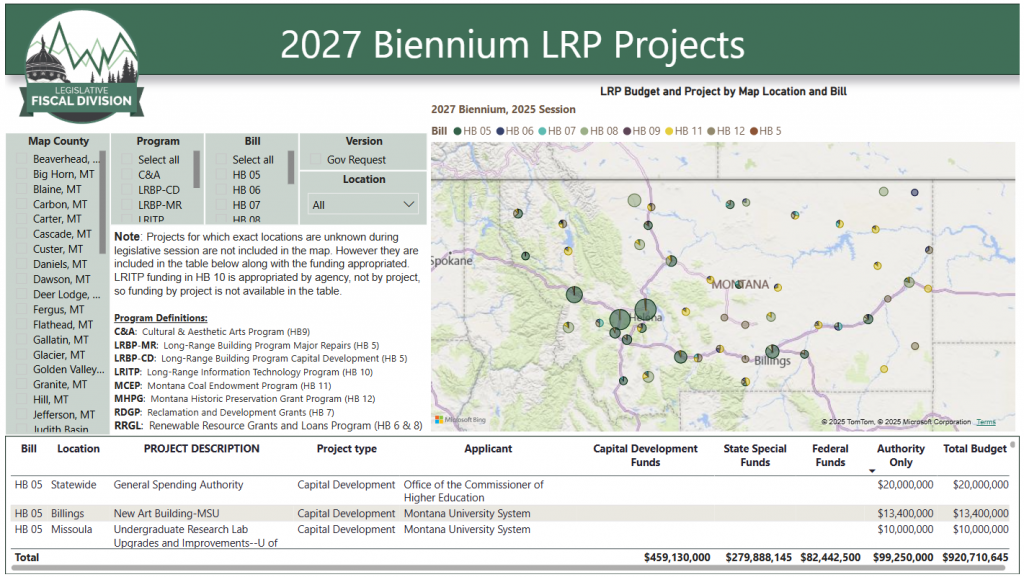 » Long-Range Planning Project Map
*click the link below this image to access the interactive data tool*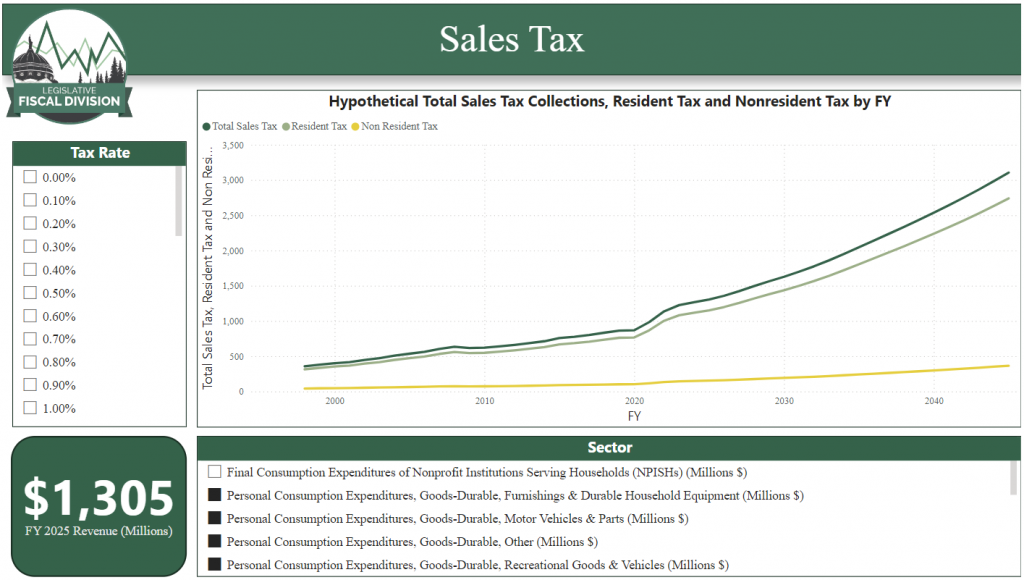 » Sales Tax Dashboard
ABOUT
Population impacts the Montana economy and particularly personal income in Montana. The correlation between population and personal income was analyzed by non-partisan legislative staff and important findings are included below.

KEY TAKEAWAYS
*click the link below this image to access the MT Population data tool*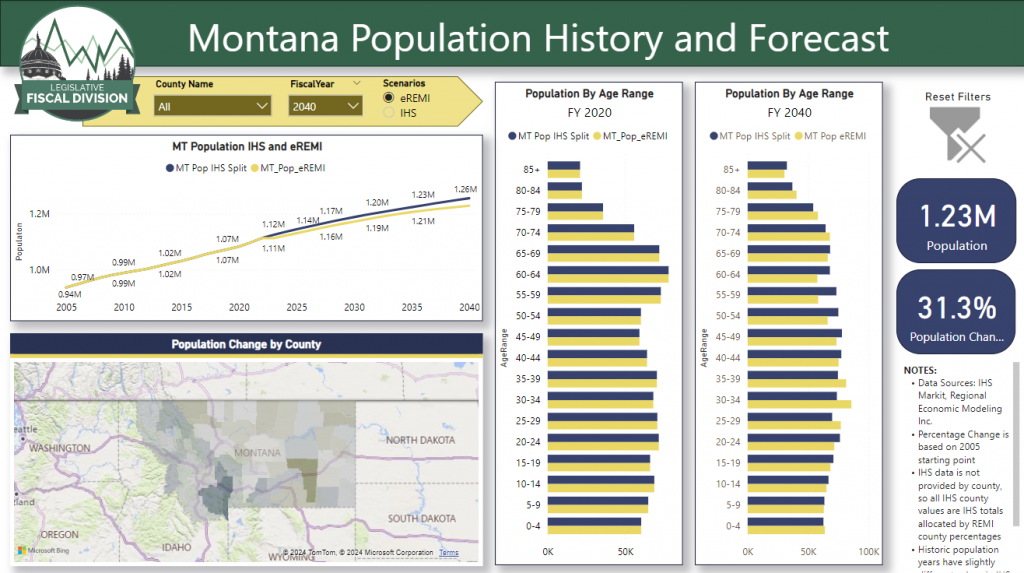 » Montana Population History & Forecast Tool
ABOUT
Property taxes in Montana are collected by multiple taxing jurisdictions such as the state, schools, local governments, and a variety of special districts. In order to better understand locally paid taxes and where the growth in property taxes has come from in the past, legislative staff created a property tax model. This work can help to answer questions in greater detail and examine certain proposed scenarios.
KEY TAKEAWAYS
*click the link below this image to access the Property Tax data tool* » General Property Tax Growth Tool
» General Property Tax Growth Tutorial
ABOUT
In 2005 Montana population was about 940,000. By 2040, population is predicted to increase to about 1.3 million. Government services for the treatment and housing costs are impacted if correctional inmate populations increase, however determining the age of Montana’s future population is important as criminal activities tend to decline with age.
Non-partisan legislative staff gathered public safety data to analyze trends in inmate populations, however more work is needed to develop the data before advanced analysis of the growth in general population and inmate population growth.
The Legislative Fiscal Division thanks the executive branch’s data effort for their collaborative role in the continued development of public safety data collections. When these data are available, both the legislative and executive branches will be enabled to provide improved analysis to decision makers.
KEY TAKEAWAYS
Increased expenditures in correctional institutions are driven by increases in the average annual cost per inmate over time. Compared to FY 2021, expenditures are expected to double by 2040, with much of the growth attributed to inflation.
No integrated, diverse criminal justice data warehouse exists to track effectiveness of improvements and assess services
Bill draft LC0357 is requested for the 2023 legislative session by the Law and Justice Interim Committee to enable the collection and compilation of criminal justice data across Montana state agencies to allow quantitative assessments
Next steps – collect and compile criminal justice data across Montana to analyze correctional inmate populations by age cohort relative to general Montana population
*click the link below this image to access the Public Safety data tool*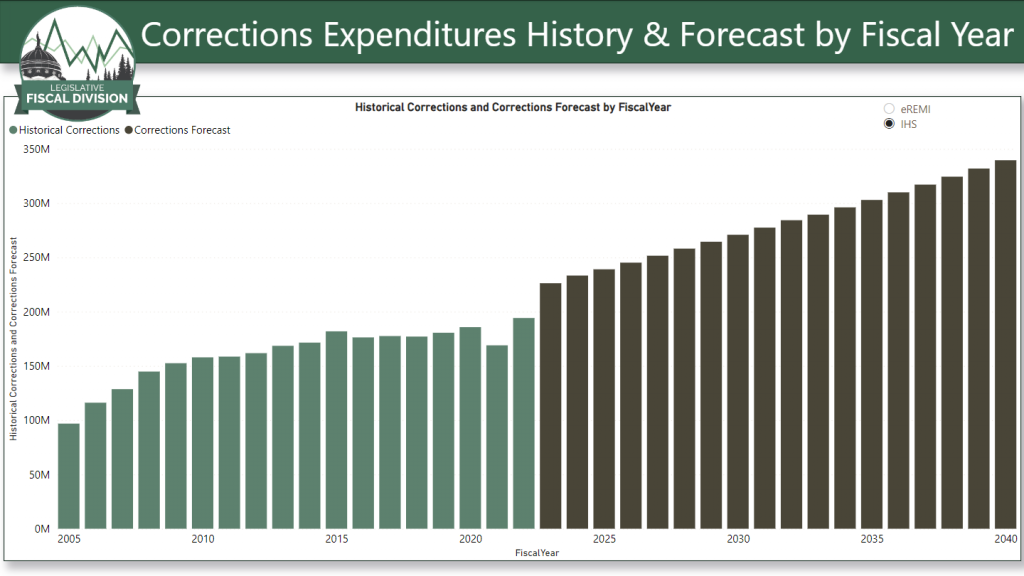 » Corrections Expenditures History & Forecast Tool
*click the link below this image to access the Public Safety data tool*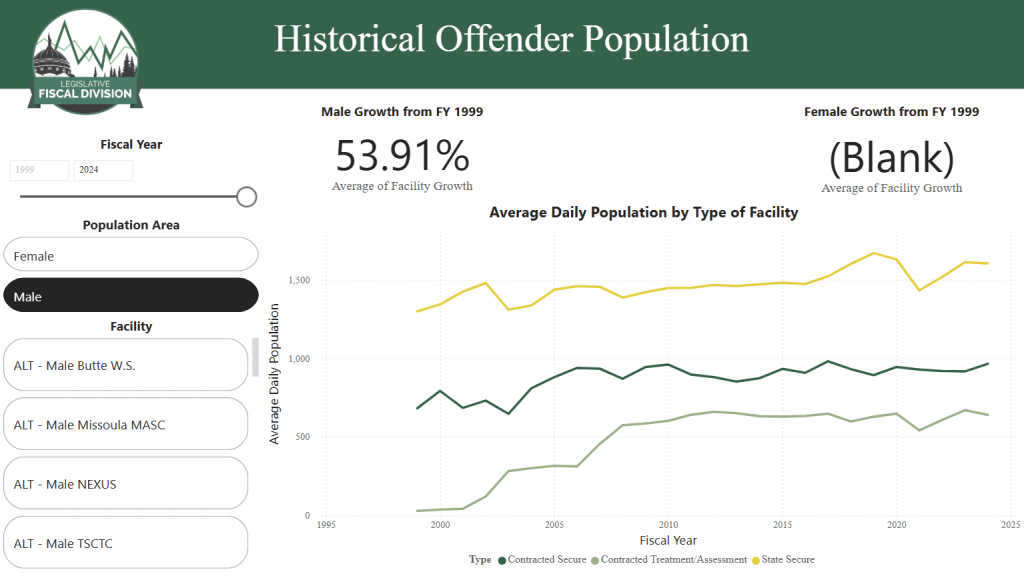 » Historical Offender Population
Public Safety
*click the link below this image to access the Public Safety data tool*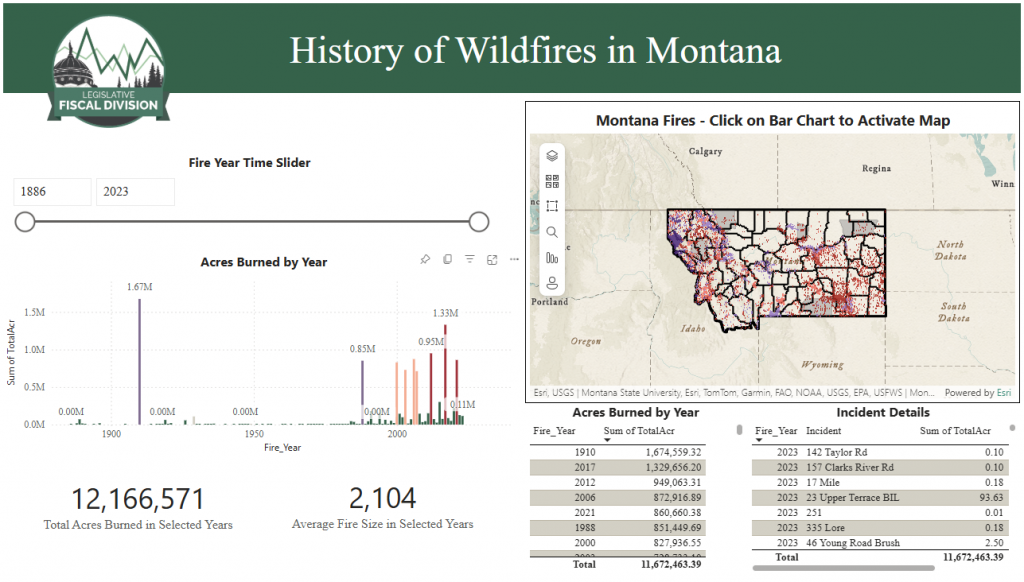 » History of Wildfires Data Tool
» Wildfire Model Presentation
